Audit Logs
Every authorization decision in Permit MCP Gateway — every tool call allowed or denied — is logged automatically. This page explains where logs live, what each entry contains, and how to use them for debugging, compliance, and incident investigation.
Where Audit Logs Live
Audit logs are accessible in two places:
| Location | What it shows | Best for |
|---|---|---|
| Platform UI (app.agent.security) | Activity views on Agent, Human, and MCP Server detail pages — pulled from Permit's API | Day-to-day monitoring, quick lookups |
| Permit.io Dashboard (app.permit.io) | Raw permit.check() decision log with full policy evaluation details | Deep debugging, compliance exports, policy analysis |
Both show the same underlying data — the Platform UI reads from the Permit Audit Logs API and presents it in context (per agent, per human, or per server).
Platform UI: Activity Views
The Platform surfaces audit logs on three detail pages:
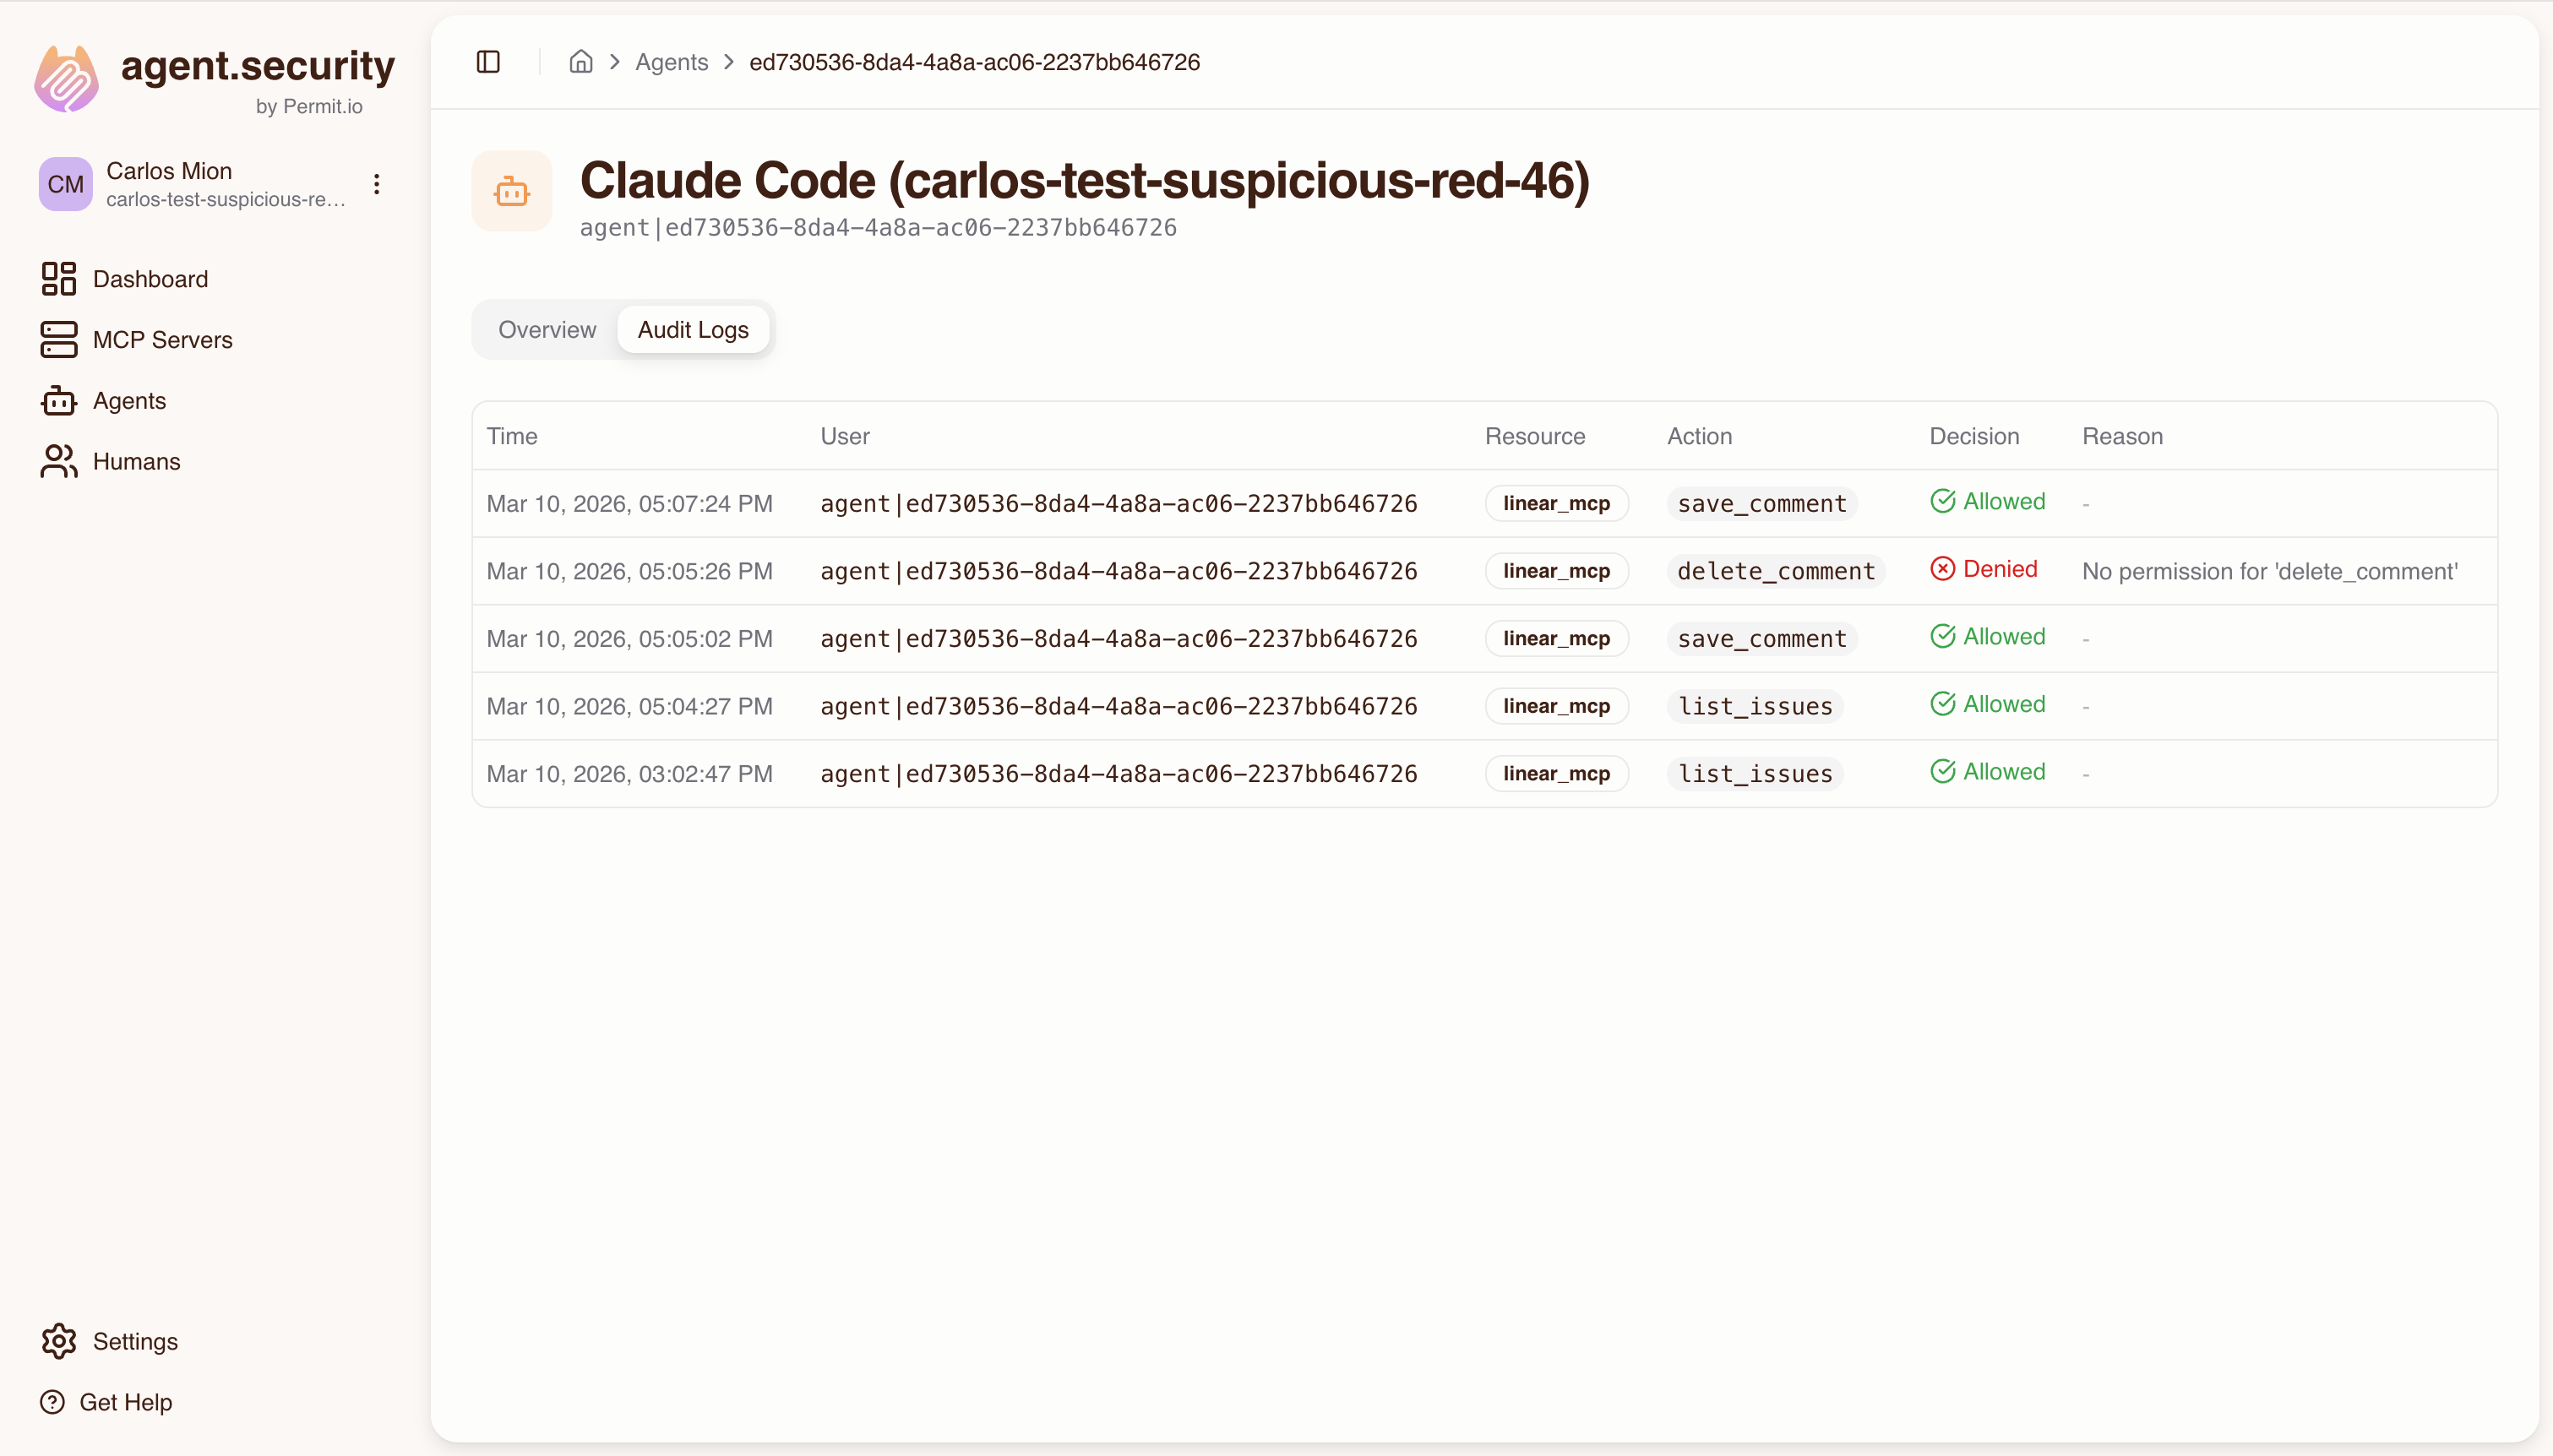
- Agent detail page — shows every tool call made by that specific agent (MCP client), with allow/deny status
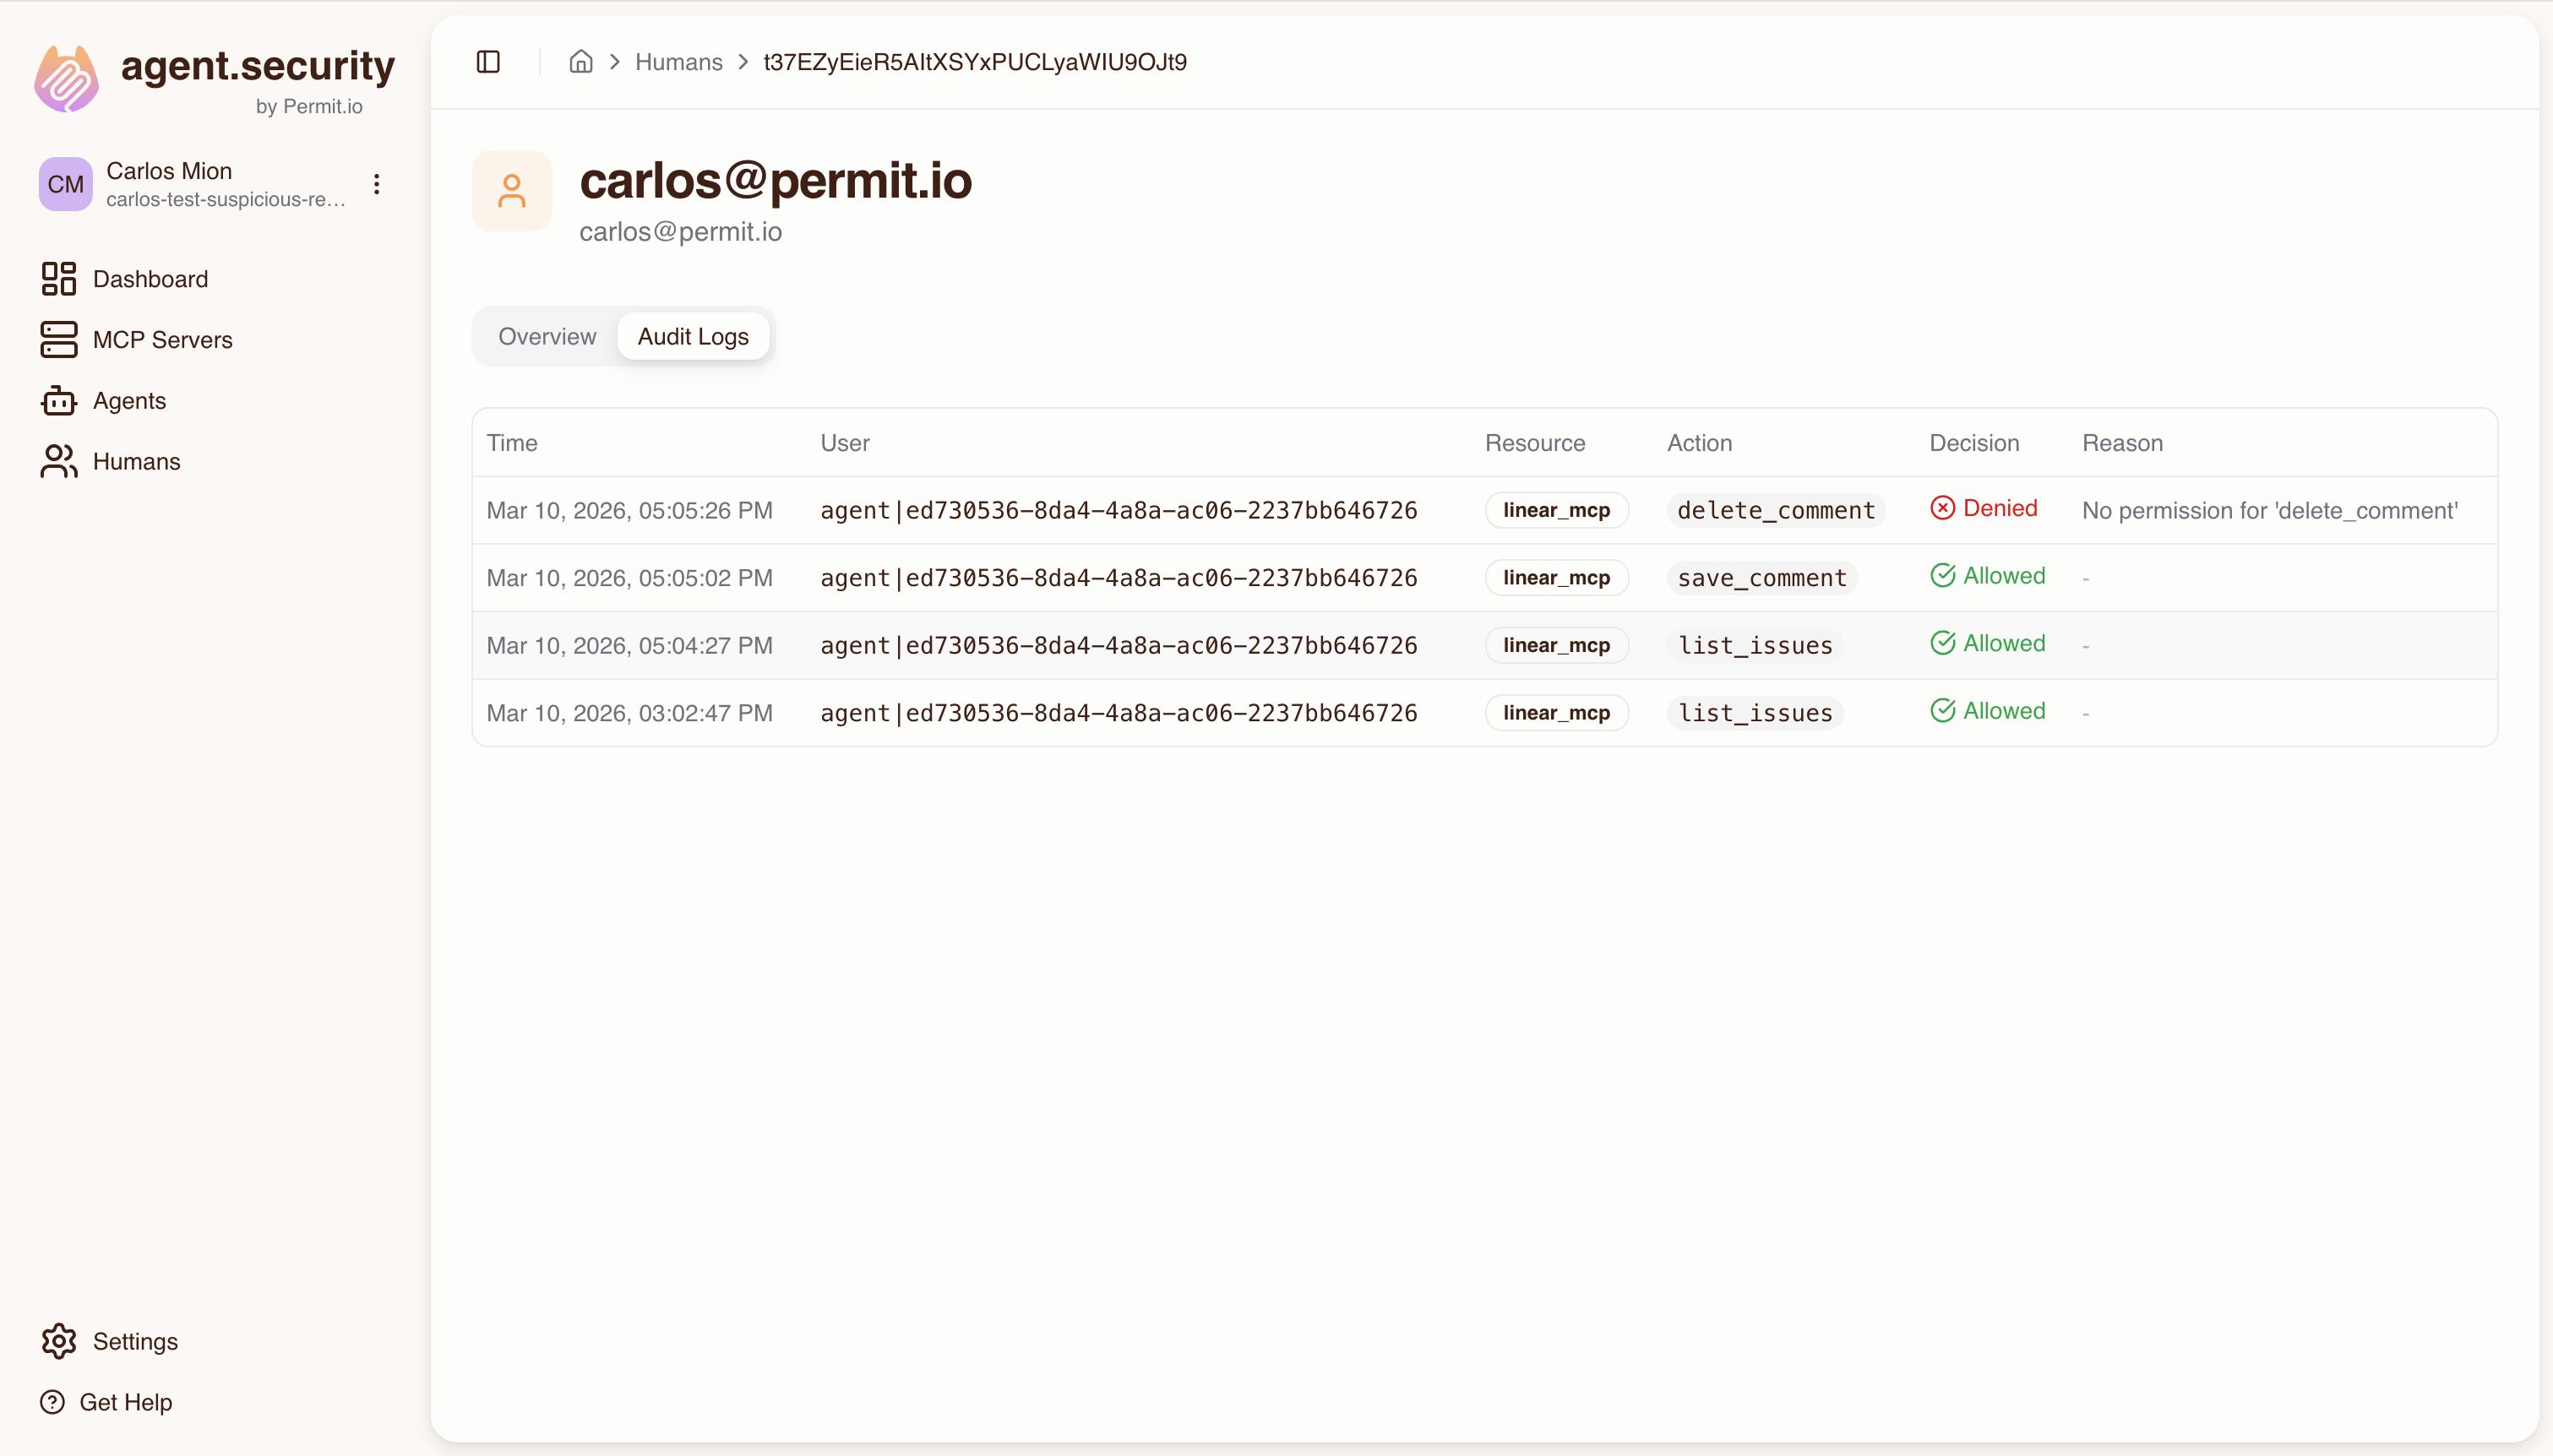
- Human detail page — aggregates activity from all agents acting on that human's behalf, not just the human's own actions. This gives a complete view of what happened under a user's authority.
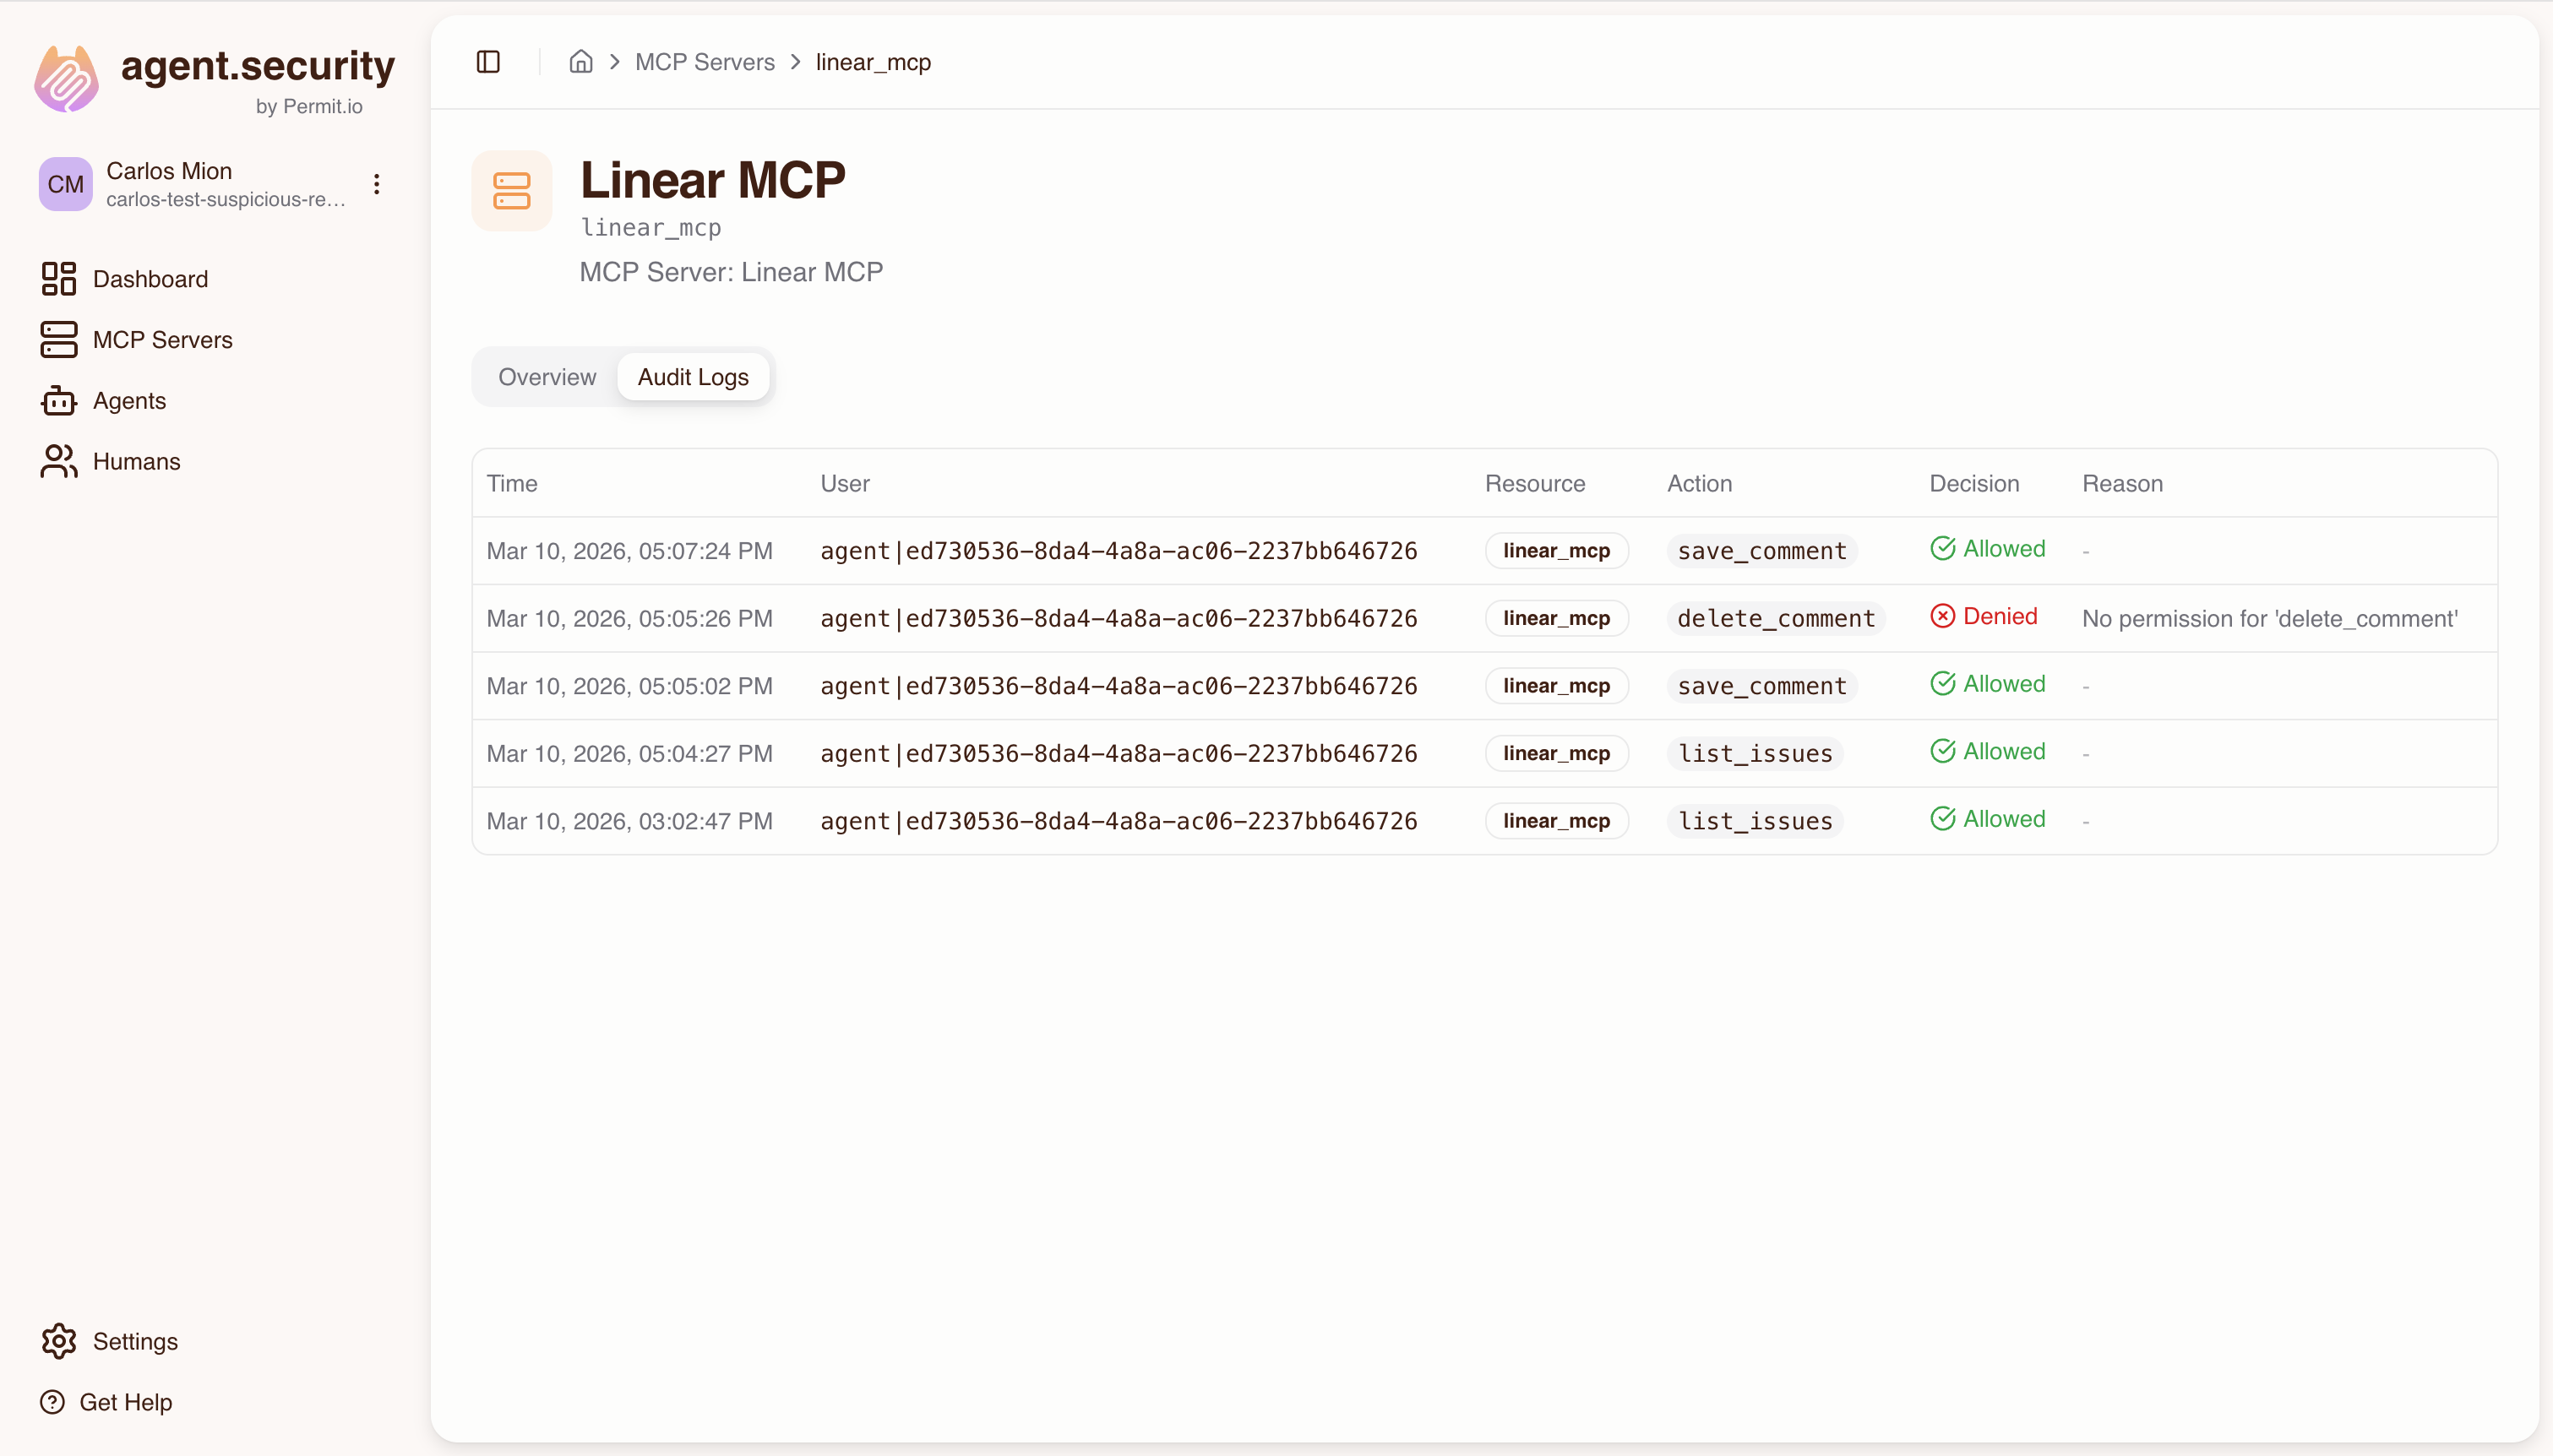
- MCP Server detail page — shows all tool calls targeting that specific server, across all agents and users
Permit.io Dashboard: Raw Audit Log
For deeper analysis, use the Audit Log in the Permit.io dashboard:
- Log in to app.permit.io
- Select the project and environment that matches your Permit MCP Gateway host
- Navigate to the Audit Log section
The Permit dashboard shows the full policy evaluation chain, including which derived roles were checked and why a decision was made — detail that the Platform UI summarizes.
Understanding Audit Log Entries
Each audit log entry represents a single permit.check() call made by the Gateway when an agent invokes a tool. Here's what each entry contains:
| Field | Description | Example |
|---|---|---|
| Timestamp | When the authorization check occurred | 2026-03-10T14:32:05Z |
| User key | The agent's identity (Permit user key) | agent|cursor_abc123 |
| Action | The tool name (slugified) | create_issue |
| Resource | The MCP server (resource type and instance) | linear:linear |
| Decision | Whether the call was allowed or denied | Allow or Deny |
| Reason | For denials: why the check failed | No permission for 'delete_repo' |
How Decisions Map to the Policy Model
When you see an audit log entry, here's how to read it against the policy model:
permit.check("agent|cursor_abc123", "create_issue", "linear:linear")
- User:
agent|cursor_abc123— the MCP client (e.g., Cursor) identified by its OAuth client ID - Action:
create_issue— the tool being called, which requires a specific trust level (e.g., medium) - Resource:
linear:linear— the MCP server, where the resource type and instance share the same key - Evaluation: Permit checks the agent's derived role on the server (via the min() trust ceiling) and whether that role has permission for the action
Denial Reasons
When a tool call is denied, the audit log includes a human-readable reason extracted from Permit's policy evaluation. Common reasons:
| Reason | What it means |
|---|---|
No permission for {tool_name} | The agent's effective trust level doesn't include this tool |
| User not found | The agent hasn't been provisioned in Permit (consent may not have completed) |
| Resource not found | The MCP server hasn't been imported in the Platform |
Filtering Audit Logs
In the Platform UI
Each detail page (Agent, Human, MCP Server) automatically scopes the logs:
- Agent page: filters by the agent's user key (
agent|{client_id}) - Human page: fetches all connected agents and shows their combined activity
- MCP Server page: filters by the server's resource type
In the Permit Dashboard
The Permit Audit Log supports filtering by:
- User — search by agent key (e.g.,
agent|cursor_abc123) or human key (e.g.,human|alice) - Resource — filter by MCP server key (e.g.,
linear) - Action — filter by tool name (e.g.,
create_issue) - Decision — show only allowed or only denied entries
Common Scenarios
"Which tools did agent X call today?"
- Go to app.agent.security/agents
- Click on the agent
- Open the Audit Logs tab — all tool calls for that agent are listed with timestamps and decisions
"Was this tool call allowed or denied, and why?"
- Find the entry in the agent's or server's audit log
- Check the Decision column (Allow/Deny)
- For denials, the Reason column explains why (e.g., trust level too low for that tool)
- For deeper debugging, check the same entry in the Permit dashboard to see the full derived role evaluation
"Show me all denied requests for debugging"
- In the Permit dashboard, open the Audit Log
- Filter by Decision: Deny
- Optionally narrow by user, resource, or time range
- Review the denial reasons to identify misconfigured trust levels or missing access grants
"Compliance report: all agent activity for the last 30 days"
- In the Permit dashboard, open the Audit Log
- Set the date range to the last 30 days
- Export or review the entries — each shows who (agent), what (tool), where (server), when (timestamp), and the decision
- For human-centric reports, use the Human detail page in the Platform to see all activity under a specific user's authority
The Permit audit log shows the raw permit.check() parameters — user key, action, and resource — making it easy to correlate with the activity views in the Permit MCP Gateway dashboard. Use the agent's user key (e.g., agent|cursor_abc123) to search across both.
Investigation Examples
These examples show how to use audit logs to answer common security, debugging, and compliance questions.
"Why was this action denied?"
A developer reports that their agent cannot create issues in Linear despite having access.
- Go to the Agents page at app.agent.security and find the developer's agent (e.g., Cursor)
- Open the agent's audit log and look for the denied
create_issueentry - Check the Reason — if it says "No permission for
create_issue", the agent's effective trust level is too low.create_issuerequires medium trust. - Check the agent's trust level for Linear — if it is low, the user needs to re-consent at medium trust
- Check the human's max trust level on the Humans page — if the admin set it to low, the admin must raise it before the user can re-consent at medium
Resolution: Either raise the admin's max trust ceiling or have the user re-consent at a higher trust level.
"Which human authorized this agent's actions?"
A security team wants to trace an agent's tool calls back to the authorizing human.
- Go to the Agents page and find the agent in question
- The agent detail page shows the Associated human — this is the person who completed the consent flow and authorized the agent
- Open the agent's audit log to see all tool calls with timestamps and decisions
- Cross-reference with the Humans page to see the human's full access grants and all agents acting on their behalf
Key insight: Every agent action in the audit log is traceable to the human who authorized it through the consent flow. The identity chain is: human → consent → agent → tool call.
"Which server or tool touched a sensitive system?"
A compliance team needs to understand all agent interactions with a specific MCP server (e.g., one connected to a production database).
- Go to the MCP Servers page at app.agent.security
- Select the server in question and open its Audit Logs tab
- Review all tool calls targeting that server — each entry shows which agent called which tool, when, and whether it was allowed or denied
- Filter by decision to focus on allowed calls (to see what actually reached the server) or denied calls (to see attempted access that was blocked)
- For each allowed call, trace back to the authorizing human via the agent's detail page
For deeper analysis: Use the Permit.io dashboard audit log to filter by the server's resource key (e.g., production-db) and see the full policy evaluation chain, including which derived roles were checked.
"What changed in an agent's access over time?"
An admin wants to understand the history of an agent's permissions.
- Go to the Agents page and select the agent
- Review the audit log timeline — look for patterns like:
- A tool that was previously allowed but is now denied (suggests a trust level change or access revocation)
- A tool that was previously denied but is now allowed (suggests a trust level increase or re-consent)
- Check the Humans page for the authorizing human — the admin's max trust level changes and access revocations are reflected immediately in subsequent tool calls
"Generate a compliance report for a specific time period"
- In the Permit.io dashboard at app.permit.io, open the Audit Log for the linked environment
- Set the date range to the reporting period
- Review or export the entries — each shows: agent identity, human identity (via cross-reference), tool called, MCP server, timestamp, and allow/deny decision
- For a human-centric view, use the Humans page in the Permit MCP Gateway dashboard to see all activity under a specific user's authority across all their agents